Box Plot
June 14, 2020
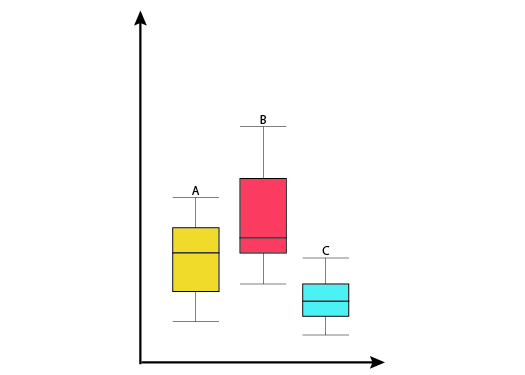
A box plot can show distribution, quartiles, median, and outlier values of your dataset. It is easy to compare the variation of groups with a box plot. Statistical calculations are existing behind the plot. Inter Quartile Range (IQR), Median and Quartiles (1st, 2nd,3rd..) are the calculations. These quantifications help us to understand the dataset better.