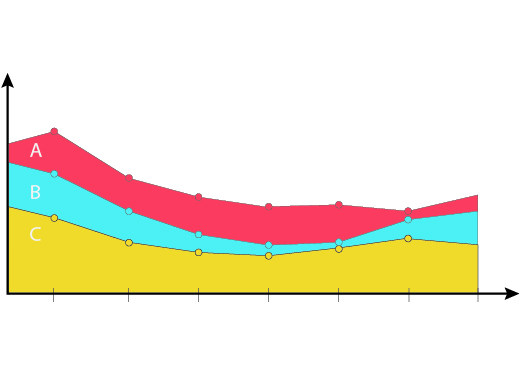
An area graph is another form of the line graph where the region under the line is filled. Plotted areas are useful to reveal the changes in the data over time. It's easy to compare subcategories and their relative changes by the time or along with the x-axis.