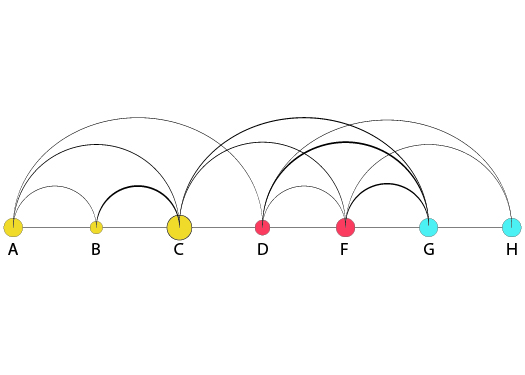
Arc diagram visualizes the connection and relation among categories represented by separate nodes on a straight line. Arc connects nodes with their thickness and color dimensions, representing magnitude and type of association. The thickness of an arc can represent a frequency, magnitude of relation, or other quantified parameters between two connected nodes. The color of an arc can represent a type of relation/association, a direction, or other categorical parameters for connected nodes.